If you were there, thanks for coming, to my session at Pause On Error October 28th, 2014. Also special thanks to Justin Close and Vincenzo Menanno for impromptu manning of the white board and stopwatch.
I think we had a good discussion about performance metrics, why they are important, and how they can influence and improve your organization. We also took a good chunk of time looking at one specific real-world problem to see how much we could improve performance using suggestions from the group.
Most of this post is devoted to the list of suggestions that people tossed out, and data on which ones had the largest impact to this specific problem. We attempted to perform these tests in a consistent repeatable manner, but results here are certainly anecdotal. Even though our stopwatch operator is a trained professional, we probably have a margin of error of 2-3 seconds. For sake of time, we also combined multiple improvement ideas between test runs.
Setup
Hardware is a FileMaker Server 13 on a Mac Mini 2GB RAM, Core 2 Duo, 5400 RPM HDD. Client machine is FileMaker Pro Advanced 13 on a Mac Book Air i5 on 5GHz WiFi-N. A simulated high performance WAN has been configured to add 10ms of round-trip latency and having a 50Mbps throughput cap.
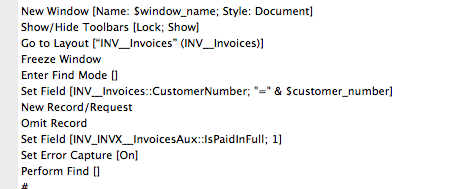
A FileMaker based business is generating a receivables statement for one specific customer. Invoices are vertically partitioned into two tables that are a one-to-one join. The first table, `Invoices`, contains the original immutable header level sales invoice data such as customer number, date, and invoice total. The `Invoices_Aux` contains header level mutable data such as `PaidInFull` flag that is set once customer payments bring the balance of the invoice to zero. The general approach to generating a statement is to find a list of all the invoices for a specific customer number, omitting any rows that have been paid. This specific script does the necessary processing, leaving the user on a new window with a customer statement in preview mode, ready for printing or PDF.
The overall solution has been used for many years and could be considered large. The `Invoice` and `Invoice_Aux` tables contain 550,000 records each. Looking close at the `Invoice_Aux` records, 99.7% of the records in the table are flagged as “paid”.
Baseline
The script has been in production in it’s current form for many months. Results are accurate and acceptable, but we’ve noticed that statements take longer to produce than we would like, seemingly worse for larger customers with more receivables history. The customer used for this test, one of the larger customer accounts, has 12,000 invoice records. Using this customer might be a worst case scenario, but will make timing tests easier.
The first run of the script took 82 seconds. We’ll call this “Scenario A”. A casual observance of the script as it ran, most of the time was clearly spent waiting for a Find to be performed (barber pole dialog).
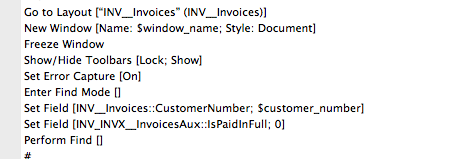
Here is a screen shot of the code snip that seems problematic.

Participant Ideas
After reviewing the script and it’s performance issues, we asked everyone in the room to throw out ideas that might help to speed things up. Here is a rundown of the ideas suggested.
Ideas to improve the Find routine
- Break the single Find into two stages: Perform Find for Part 1, then Constrain for Part 2
- Enter Find mode first
- Add redundant criteria (in second find request, omit customer=x & paid=1)
- When restricting to “Unpaid” invoices, do a “Find paid=0” instead of a “Omit paid=1” (requires auto-enter 0 on new/unpaid invoices instead of blank)
- Context of Find starting point: start in Invoices_Aux
- Store a copy of “Customer#” data in Invoices_Aux
- Use GTRR to constrain the results by value in “Paid”
- Perform find on server (unclear if this is different than idea 14)
- Server RAM upgrade & increased server database cache
- Network connection, server location (relocate server to reduce latency and increase bandwidth)
- Use export/import steps instead of Find
- In the Find criteria for customerID, just put the ID (e.g. “1234”) instead of “=1234” in the field value
- Upgrade from server HDD to SSD
- Perform partially on the server to return CustomerIDs, then GTRR
- Are the fields indexed? [YES]
- What is the caching configuration on the client?
Improvement Trial – Scenario B
Idea 9 – Server ram upgraded from 2GB to 4GB. Machine rebooted. FileMaker server database cache increased from 256MB to 512MB.
Idea 10 – Relocate the server closer to the client. Effectively we reduced network latency from 13ms to 3ms and increased our bandwidth from 50Mbps up to about 200Mbps.
Run time after these improvements: 84 seconds, 2% more time than before the original scenario A. (This change of 2 seconds seems to be within our margin of error.)
These changes left in place.
Improvement Trial – Scenario C
Idea 2 – Core idea here is to avoid unnecessary expense related to the new window step. We did this by switching to a blank layout before opening a new window.
Idea 12 – Change search syntax for the customer number field. Since this field is a number with an auto-increment serial number, it should be unnecessary to use the “=“ operator in this search. Searching for “1234” should return the same results at “=1234”.
Run time after these improvements: 34 seconds, 60% less time than in the previous scenario B.
These changes left in place.
Improvement Trial – Scenario D
Idea 1 – Beak down this find that currently has two “requests” into two simpler stages. Perform a find for the first criteria. Then enter find mode again and constrain on the second criteria.
Run time after these improvements: 31 seconds, 9% less time than in the previous scenario C. (This change of 3 seconds seems to be within our margin of error.)
These changes were reverted before continuing.
Improvement Trial – Scenario E
Idea 4 – When restricting to “Unpaid” invoices, find on paid flag “0″ instead of a Omit paid flag “1”. This means we need to slightly alter our database schema such that every new record starts with an auto-enter value of zero. Scripts that alter this field most always set it to zero or one. No records will have this field blank. This concept is a classic database design problem of NULL vs ZERO. Take note that this also means that we are performing a single find with a single request.
Run time after these improvements: 3 seconds, 91% less time than in scenario C.

Solution Recap
Using many good optimization ideas from the group, along with some trial and error, we were able to reduce statement generation time for this test customer from 82 seconds to 3 seconds.
Cardinality Pitfalls
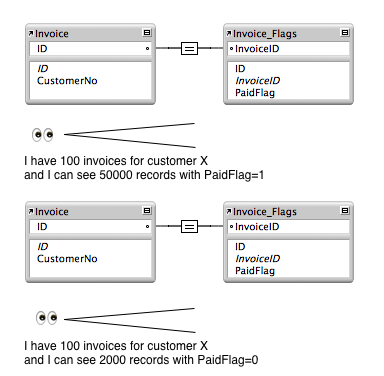
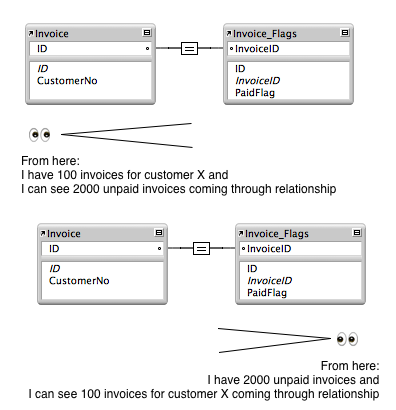
Be conscious of your data and it’s statistical distribution. Fields that only have a few unique values can result in many matching records. If you think of searches (Perform Find or Go To Related) as a relay, each relationship is like a handoff. If you are passing a baton with thousands of records you may face big slowdowns. Good ways to alleviate this problem may be to invert your search logic, such as “Omit No” instead of “Include Yes”.

Another viable option can be to cross the fence to where the grass is greener, performing the find on a layout that is on the other side of the relationship. For example, a baton with hundreds of records that match a customer number might be less expensive then a baton with thousands of unpaid invoices.

Key Take Away Items
A few critical pieces were essential to enable this improvement:
- Real World Data – Performance problems are often hard to conceive during initial development. Even if you synthesize a few months or years of sample data, real world performance characteristics may change once the user has begun entering their real data.
- Testing Tools – In this case we used a simple stopwatch to look for drastic performance gains. More sophisticated tools will be necessary now if we want to continue optimizing to shave off fractions of seconds.
- User Analytics – Some way of knowing that end users are experiencing a problem along with data on how often, and in which situation(s) the problem is encountered.
- Skilled Developers – Having experienced developers is important. But also, developers get smarter about their solutions when you provide them with analytics data and set specific performance goals for the solution.
3 Comments
-
I can explain the two major performance improvements in a little more detail
Both are relatively simple
Number vs. exact match (“123” vs “=123″) – the difference is that when simply searching for a number you leverage the numeric index as much as you can – FileMaker just gets list of record IDs straight from the index, no need to do anything with them.
Exact match though generated extra burden because after using the index to retrieve the candidate IDs, Draco has to go trough them and compare the exact stored value with the search query.
The second one – you could most likely achieve similar result simply by doing a search for empty value (putting “=” in the paid flag). The main difference is not find versus omit but two versus one request.
With two requests, Draco has to find all records matching the first query, and then apply the second query to the result found set. With one combined request it performs just a single query. Also searching for empty paid flag could be done without any data model change. -
Author
I should mention, that in Scenario C, the group consensus was that “idea 12” netted most of the performance gain. If time allows, I would like to nail this down percisely with some additional testing.
-
A great write-up – simple and easy to understand and very informative and useful, thank you for taking the time to share!
Leave a reply
You must be logged in to post a comment.

